BETA Coefficient as a REIT Asset Management Factor
By: Roni Appel, MBA, Prof. Assaf Zeevi, Ph.D, Luis De La Balze, Hai Sitton
Beta is a measure of the volatility of a security, or of a portfolio of securities compared to the market as a whole. Statistically, Beta represents the slope of a regression of an individual stock’s returns against those of the market as a whole, for a defined period of time.
A security’s Beta is calculated by dividing the covariance of the security and the market, by the market variance (volatility):
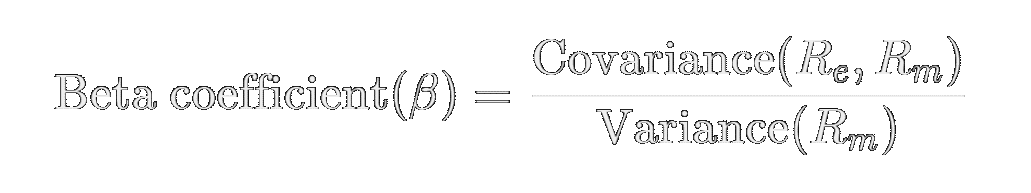
Covariance measures the linear relationship between two assets (or an asset and the market). A positive covariance means they move together while a negative covariance means they move in opposite directions. Variance measures the dispersion of a random variable.
As a representation of the market, it is common to use the S&P 500 or Dow Jones Index, and in the case of REITs the MSCI US IMI Real Estate 25/50 index. The index used must be appropriate given the characteristics of the security. To make sure the stock is being compared to the appropriate benchmark, the stock should have a high correlation (or R2) in relation to that index. R-squared measures the percentage of a security’s price movement that can be explained on price movements of the index. A higher R-squared value indicates a more relevant benchmark.
Portfolio managers use beta as a form of quantifying how much risk is added to the portfolio by adding that particular stock.
Beta = 1
It is assumed that the market has a beta score of 1. Any security with a beta of 1 is expected to have high correlations to the the market. In theory, a security with a Beta of 1, only has systemic risk (market risk). Adding a stock with a Beta of one does not add any risk to the portfolio, nor does it add any additional expected return.
Beta > 1
If a security has a Beta above 1, it is more volatile than the market as a whole. Suppose a security has a beta of 1.5. This would mean the stock’s price moves 1.5% for every 1% movement of the market as a whole. If market is expected to return 10%, the security would be expected to return 15%. High growth stocks such as those found in the Nasdaq index tend to have Beta values over 1.
Beta < 1
A Beta value less than 1 means the security is less volatile than the market. Adding this security would lower the expected volatility of the portfolio along with the expected return. Utility stocks and to a lesser extent real estate, tend to have Beta values less than 1.
Beta < 0
A negative Beta value indicates that the security acts as a hedge against market volatility. A Beta of -1, means the security is perfectly negatively correlated with the market. For instance, a 10% decrease in the market, would push the security 10% upwards. Put options and inverse ETFs tend to be products with perfect -1 Betas. Gold has negative beta tendencies.
It is important to note that Betas are calculated using historical data, and that the past may not reflect the future. A change in tendencies, or a change in the macro environment could lead to different Betas from their historical values.
The Beta coefficient theory relies to an extent on the assumption that returns are normally distributed. This is rarely true in practice, which may further hinder the suitability of betas in predicting future price movements.
In REITs, different sectors have experienced different relationship with the market overall. Below, we illustrate the sectors (represented by the two leading market cap REITs) and their respective Betas calculated over a period of 5 years (the table was calculated based on the average of the two largest REITs from the sector).
| Sector | Beta (02/17 – 02/22) |
|---|---|
| Mall | 1.73 |
| Lodging | 1.67 |
| Strip Center | 1.30 |
| Healthcare | 1.03 |
| Office | 0.95 |
| Residential | 0.85 |
| Industrial | 0.78 |
| Net Lease | 0.77 |
| Single Family Rental | 0.75 |
| Tower | 0.49 |
| Data Center | 0.39 |
| Self Storage | 0.32 |
(Source: Charles Schwab)
We can see from the table above that the mall and lodging REIT sectors have experienced higher volatilities than the overall market. Health care and office were about the same as the market, while self-storage, data center and tower have experienced low betas. These latter sectors have experienced strong tail winds growing consistently with few setbacks, which is a possible reason for their low values. Industrial, data center and tower, are characterized by long term trends and their relatively low betas, may not indicate their potential for price increases going forward.
The mall, lodging and strip center sectors may experience the opposite effect. While high betas may be related to high growth and potentially strong returns, it is important to note that specially in the case of mall and strip center, these are in a long-term downward trajectory (low growth). For these reasons, beta alone may not be a sufficient indicator for understanding the return/risk relationship in securities and must be analyzed in the context of additional fundamental and technical factors.
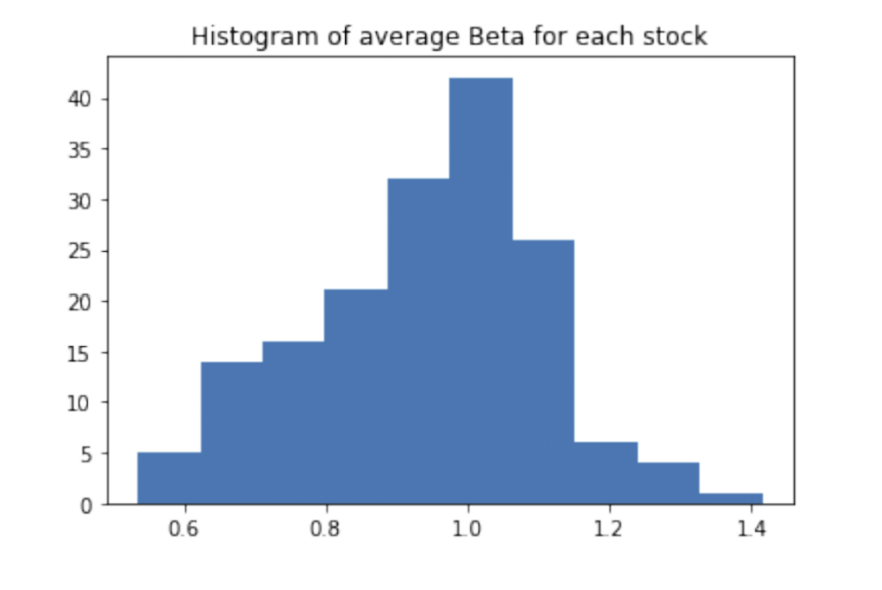
Below, we show the histogram of betas for a large number of individual REITs. It is evident from the charts below that in general terms real estate closely tracks the overall equities market. It is important to highlight that the distribution is positively skewed, B < 1 is more prevalent than B > 1.
We would expect stocks with higher betas and therefore, higher standard deviations, to provide potentially higher returns. The graph below plots future 12-month returns (including dividends) relative to betas over a period of 10 years. It is clear from the chart that beta has a positive correlation with future returns with higher betas providing potentially higher returns.
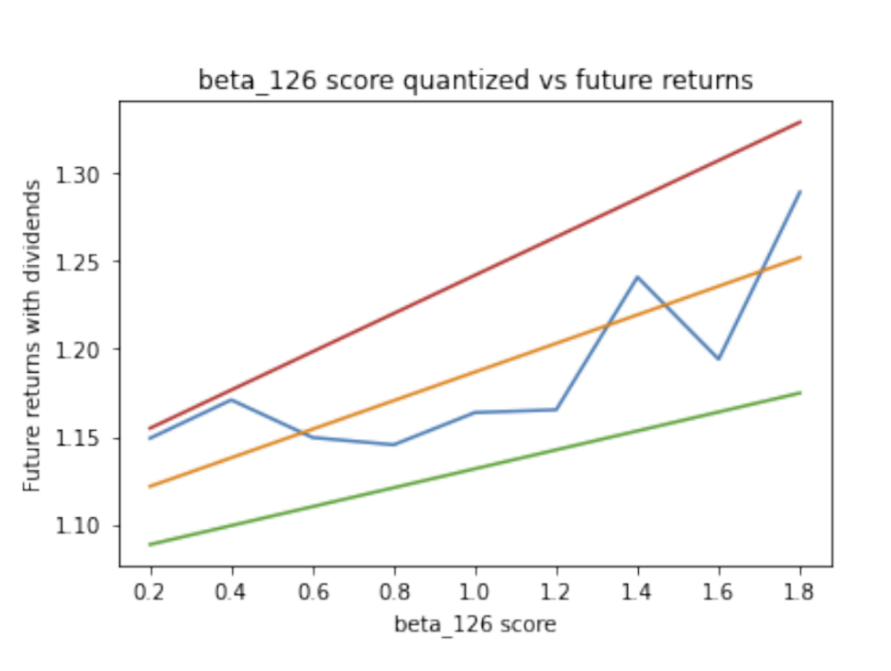
The red and the green lines represent the upper and lower bounds of the possible slope regression at a 95% confidence level. In other words, there is a 95% probability that the actual regression line falls between the upper red boundary and the lower green boundary.
In all cases we find a significant (low P-value) effects of beta as an explanatory variable, yet the R-squared tend to be quite small indicating that although beta does explain some of the variation of future returns, other variables must also be considered to provide more explanatory power.
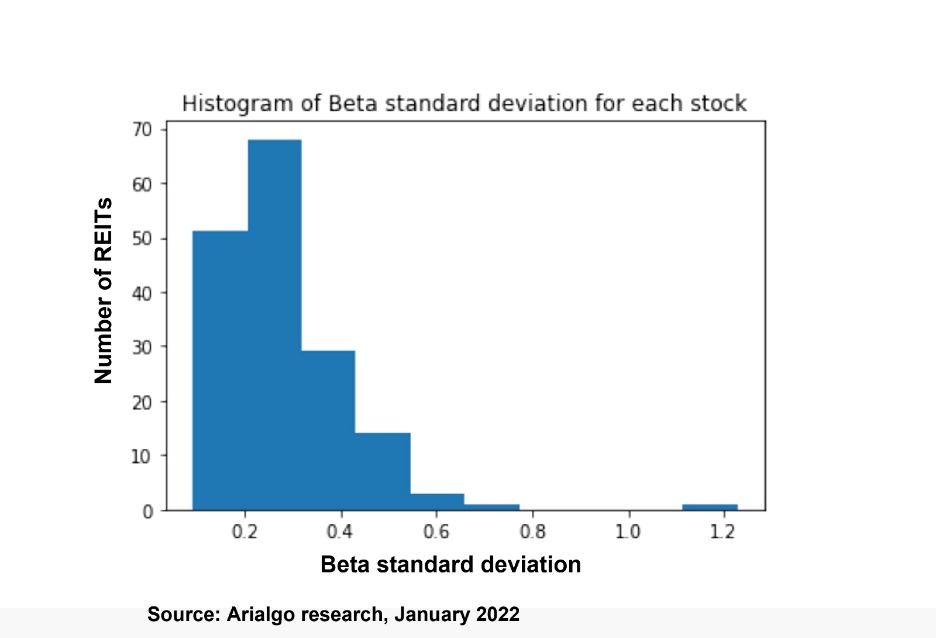
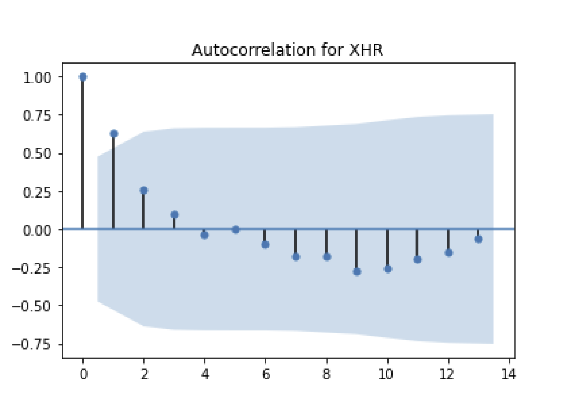
The chart below demonstrates statistically that the beta will usually remain confined to a range and can be trusted to remain in such range. Large deviations for beta are not common.
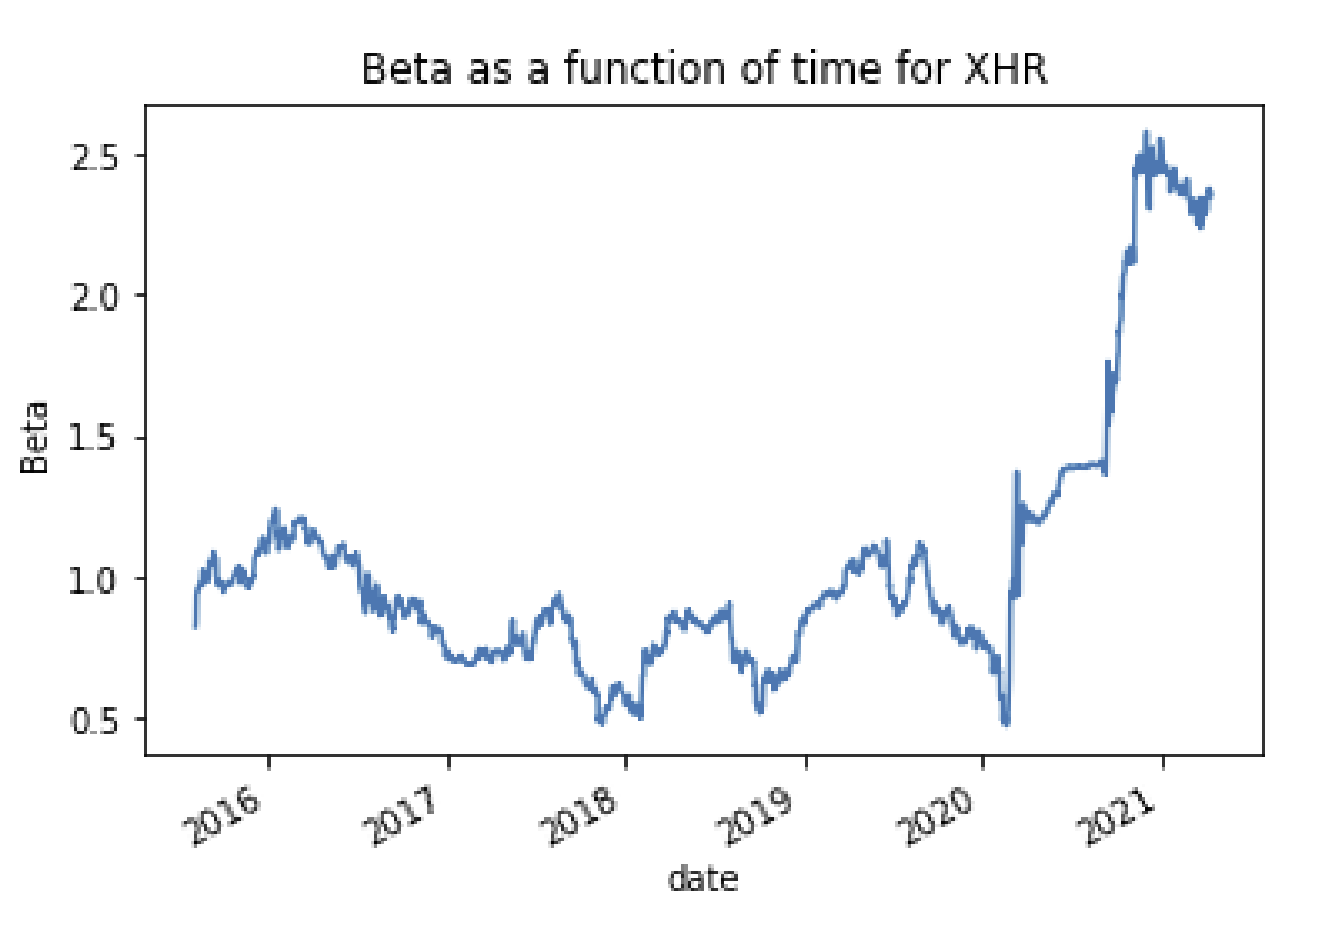
The chart below shows the beta as a function of time for particular REIT, Xenia Hotel % Resorts (XHR). We can see that beta may not be constant and may fluctuate widely for a security within a given timeframe. The pandemic had a strong effect on the lodging industry and abnormally pushed the stock to high betas (of around 2.5).
The below chart demonstrates that once a REIT has a small beta (or large), which the beta will fluctuate in that given range, it will usually remain within such range. Therefore, the REIT can be “trusted” to provide such values of beta and therefore, this can be used in engineering the risk return properties of a portfolio in the framework of multi-factor models.
In summary beta is a useful tool for managing the risk and return of a REIT portfolio that may be used in conjunction with other measures and analysis. Although for some sectors, beta has experienced unusually high volatility due to the pandemic, large deviations are not historically common, giving portfolio managers a tool in assessing and managing risk.