The Behavioral Alpha Matrix
Every active manager publishes attribution. Few attribution reports actually tell you whether the decisions behind the returns were correct. They show how much money each position made or lost, how each sector performed, and where the portfolio differs from the benchmark. They stop short of judging behavior. The Behavioral Alpha Matrix (BAM) - the third analytical layer in the Arialgo Portfolio Attribution System - is built to close that gap.
From a data view to a decision view
Conventional attribution answers two questions: what happened, and where did it happen? Position-level contribution (CTR/CTI) answers the first. The Brinson-Hood-Beebower framework answers the second by decomposing active return into allocation, selection, and interaction effects. Both are useful. Neither tells the manager whether the decisions behind the numbers were correct. A negative selection effect does not distinguish between a position held too heavily, a position held too lightly, and a position not held at all. The behavioral analysis still has to happen in the manager's head.
There is also a subtler problem: in conventional attribution, the sign of a number does not always agree with the words next to it. A position can show a positive contribution and still represent a missed opportunity. A sector can post a negative selection effect while the underlying picks were correct. The arithmetic adds up. The narrative does not. BAM is designed to fix both gaps at once - by re-anchoring attribution around decisions rather than outcomes.
The four quadrants
Every position, every non-held index constituent, and every exit during the period is placed in one of four behavioral quadrants. The axes are deliberately simple.
- Did you hold more or less of this stock than the index did?
- Did the stock outperform or underperform that same index?
Overweight a stock that outperformed: you rode the momentum correctly. Overweight a stock that underperformed: you entered a trap. Underweight a stock that underperformed: you avoided a trap. Underweight a stock that outperformed: you missed the momentum. The labels are not decoration. They map directly onto the behavior the alpha came from.
Two innovations, not one
BAM combines two distinct innovations that are easier to evaluate when stated separately.
Mathematical innovation - the sign identity guarantee. Alpha for each position is computed as (active weight) × (stock total return − index total return). Because the quadrant a position falls into is determined by the signs of exactly those two terms, the sign of the alpha is forced to agree with the quadrant. Overweight and underperformed is always negative alpha. Underweight and outperformed is always negative alpha. The arithmetic and the narrative cannot disagree, ever, by construction. This is the property we call the sign identity guarantee - and it is what lets a portfolio manager read the matrix and trust the conclusions without re-deriving the math.
Operational innovation - attribution as a decision-feedback layer. BAM is not only a post-period explanation of what occurred. It is a structured diagnostic on the process that produced the portfolio - exposing the behavioral pattern behind the result so that the next period's construction can respond to it. Inside the Arialgo system, BAM functions as a feedback layer over an AI-driven construction engine under human oversight. But the framework is methodology-agnostic: whether the decisions came from a systematic model, a discretionary manager, or a hybrid of both, BAM places them on the same four-quadrant grid and asks the same question of each - was this directionally correct, and how much did it cost or earn? It exposes weaknesses in behavior regardless of the source of that behavior.
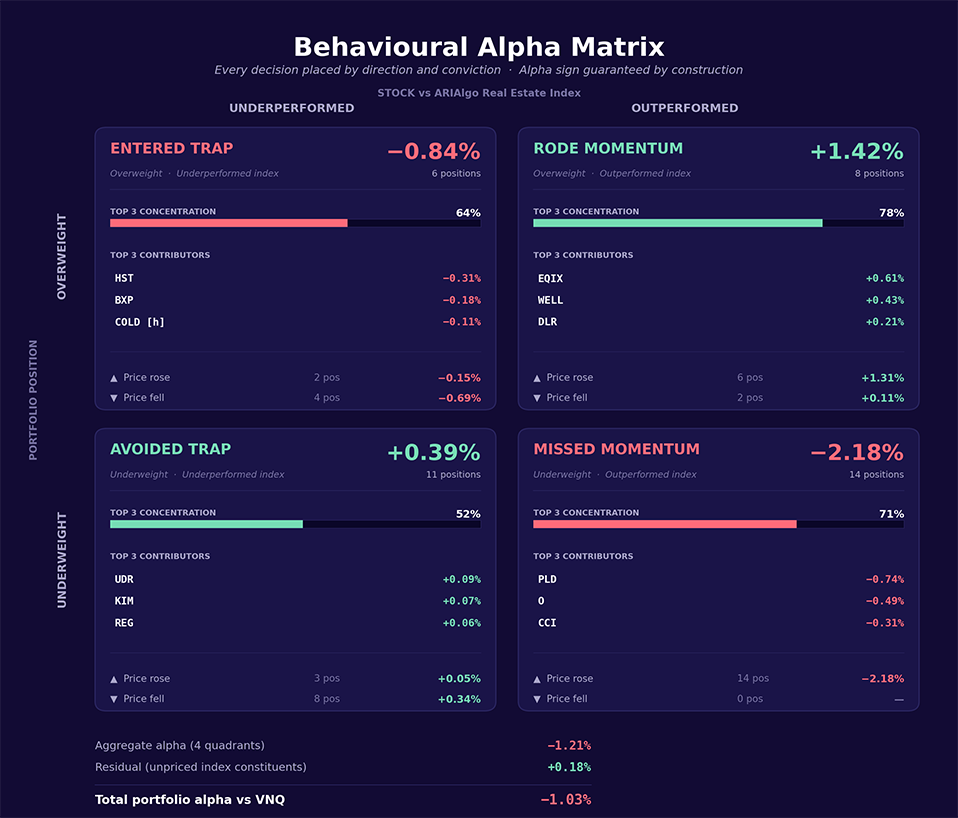
Worked example · Alpha of −1.03% vs VNQ · what the manager actually did
Reading a headline alpha number through the lens of portfolio-manager behavior
Reading the matrix
Figure 1 shows the BAM for an illustrative REIT portfolio. The story it tells is one a numerical attribution table would have buried. Total alpha versus VNQ is −1.03% for the period. The aggregate of the four quadrants accounts for −1.21% of that figure; a small positive residual (+0.18%) comes from index constituents the data does not cover. The interesting question is how that −1.21% was generated - and the matrix answers it immediately.
The single largest source of alpha destruction is not the portfolio's losers. It is Missed Momentum: −2.18%, fourteen positions, top-3 concentration of 71%, with PLD, O, and CCI accounting for the bulk of it. These are not stocks the portfolio held badly. They are stocks the portfolio held too little of - large index constituents that ran during the period while the portfolio's exposure to them sat below benchmark weight. The Rode Momentum quadrant earned back +1.42% from a smaller, more concentrated set of correct overweight calls (EQIX, WELL, DLR), but it could not offset the structural underweight to the index's biggest names.
A standard BHB report would have shown most of this as a negative allocation effect distributed across several sectors. The BAM reframes it: the issue is not allocation across sectors, it is conviction in the largest names within the index. The Entered Trap quadrant (−0.84%) confirms that stock-picking among the holdings was a secondary problem, not the primary one. Avoided Trap (+0.39%) is small comfort — the portfolio was correctly underweight in several declining names - but its modest scale shows that defensive avoidance was not the lever that drove relative performance.
What the structure tells you
Within each quadrant, two further dimensions sharpen the diagnosis. The top-3 concentration bar separates episodic errors from systematic ones. A high concentration (Missed Momentum at 71% in Figure 1) means a small number of large decisions drove the result. That is fixable with a rule - for example, a minimum weight floor for any index constituent above a certain market cap. A low concentration (Avoided Trap at 52%) means the result came from a diffuse pattern across many positions. That points to a selection methodology question, not a sizing one. The two patterns require different responses, and the matrix makes the distinction visible at a glance.
The sub-group split by absolute price direction adds a final layer. Within Entered Trap, four of the six positions actually fell in price during the period (−0.69% of the −0.84% loss). These were classic value traps with absolute signals that were available in real time. The other two rose but lagged the index - a subtler error that is harder to detect prospectively. Within Missed Momentum, all fourteen positions had positive absolute returns: the signals were obvious, the positions were just too small. That distinction matters when designing the response.
Why we call it behavioral
Each quadrant maps onto a well-known pattern in the behavioral finance literature, and the matrix exposes those patterns whether the underlying process is human or systematic. A note on terminology: "momentum" here refers to the simple fact that a stock outperformed the index during the period - for any reason, including quality, re-rating, macro sensitivity, earnings revision, or defensiveness. BAM is not a momentum framework; it is a framework for evaluating whether positioning matched the names that led the index, whatever caused them to lead. Underweighting clear winners - the Missed Momentum quadrant - is the signature of benchmark-hugging and career-risk avoidance: large index names feel safe to underweight because if the portfolio underperforms with them, so does everyone else. Overweighting laggards - Entered Trap - is value-trap anchoring: conviction built around a thesis that the market is wrong, sustained past the point where the price action says otherwise. Small position sizes in names that turn out correct - the diffuse half of Rode Momentum - is lack of conviction: the model or the manager was right, but did not size accordingly. And Avoided Trap, when it is the dominant positive quadrant, can be structural risk aversion masquerading as discipline. None of these are accidents. They are stable tendencies that show up in decision logs again and again. BAM names them, sizes them, and locates them by ticker - which is what makes the framework behavioral rather than merely descriptive.
From explanation to improvement
One of the most consistent patterns in active management underperformance is not poor stock selection. It is sizing failure relative to the index - being right about a name but holding too little of it, or being wrong and holding too much. Conventional attribution reports the symptom: a negative allocation effect, a sector that disappointed, a benchmark beat that did not materialize. BAM reports the behavior: which decisions were directionally correct, which were not, and how much each cost or earned. The shift matters because the conversation after every period changes from what went wrong - answered with a list of negative numbers - to which of four specific behavioral patterns dominated, and whether that pattern was episodic or systematic.
That reframing is what turns attribution from a backward-looking report into a forward-looking diagnostic. The four quadrants do not just account for last quarter's alpha; they tell the manager - or the system, or both - where the next quarter's effort should go. Episodic, concentrated errors call for targeted rules. Diffuse, systematic patterns call for revisions to the selection or sizing methodology itself. Both are visible directly on the page.
The goal of attribution should not be to explain returns. It should be to improve future decisions. BAM is built on that premise. It does not replace contribution analysis or BHB attribution - both remain in the Arialgo reports, answering the questions they were designed for. What BAM adds is the third question those frameworks do not ask: not what happened, not where, but whether the decisions were right - and with the sign identity guarantee in place, the answer can be read directly off the page.