When the Trend Lies: A Mean-Reversion Signal Hiding in Plain Sight
There is a piece of market folklore that says when a short-term moving average crosses above a long-term moving average, it is a buy signal: the trend is your friend. We tested that idea systematically across 134 US REITs over 12 years - and in this sample, the relationship goes the other way. When the 50-week moving average sits well above the 100-week, the next year has tended to deliver a loss, not a gain.
This note explains the finding, shows it in two well-known names (American Tower and Prologis), and lays out the heat map that summarises the entire experiment.
The setup
For every REIT in our 134-name universe, we computed two moving averages of the weekly price: a fast one (50 weeks) and a slow one (100 weeks, roughly two years). Their ratio is our signal. When the fast MA is above the slow MA, the stock appears extended relative to its longer-term trend. When the fast MA is below, the opposite.
We then looked at what happened to the price over the following 3, 6, and 12 months, pooled across every symbol and every weekly observation - about 75,000 data points per pair. We tested 36 different fast/slow combinations from 10 to 150 weeks.
The hypothesis going in was the conventional one: fast above slow should predict positive returns. That is not what we found.
Case study: two names, three windows
American Tower (AMT) is a cell-tower REIT and one of the sector's largest names. In early 2020 - just before COVID hit - its 50-week MA had climbed to roughly 17% above its 100-week MA. The trend looked unambiguous. Twelve months later, AMT was 8% lower.
Prologis (PLD), the largest industrial REIT, had its own moment in April 2022 - the 50-week MA stood 16% above the 100-week. Twelve months later, PLD was down 27%, and the gap between the two MAs had closed substantially.
The mirror image works too. In September 2023, AMT's 50-week MA was about 12% below its 100-week MA - the stock had been in a long drawdown driven by rising rates. Twelve months later, AMT was up 41%.
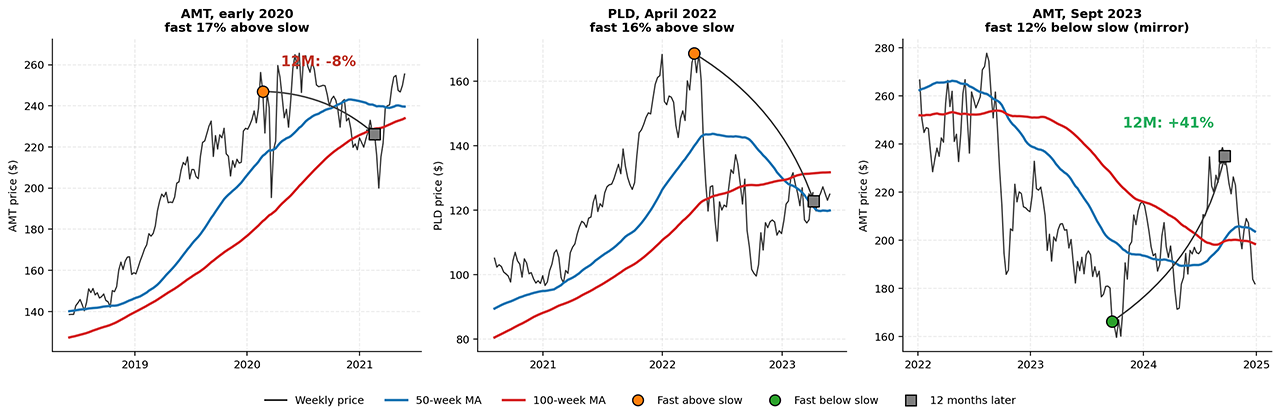
These three cases are not cherry-picked outliers - they are the most extreme instances of a pattern that shows up across the whole REIT universe.
The pattern in one picture
The case studies use the 50w/100w pair because the two horizons are visually distinct and intuitive to read; in the full grid, the strongest statistical relationship comes from the closer 50w/60w combination, with neighbouring pairs giving similar results. We measured the strength of the signal using the information coefficient - the rank correlation between the fast/slow ratio today and the price return twelve months from now. Negative values mean mean-reversion: a high ratio today is associated with a lower return tomorrow. Positive values would mean trend-following.
The relationship is negative across the 3-, 6-, and 12-month horizons, across the three subperiods we tested (2014-2017, 2018-2021, 2022-2026), and for roughly 80% of the individual REITs in the sample. It is not a single-regime or single-name phenomenon.
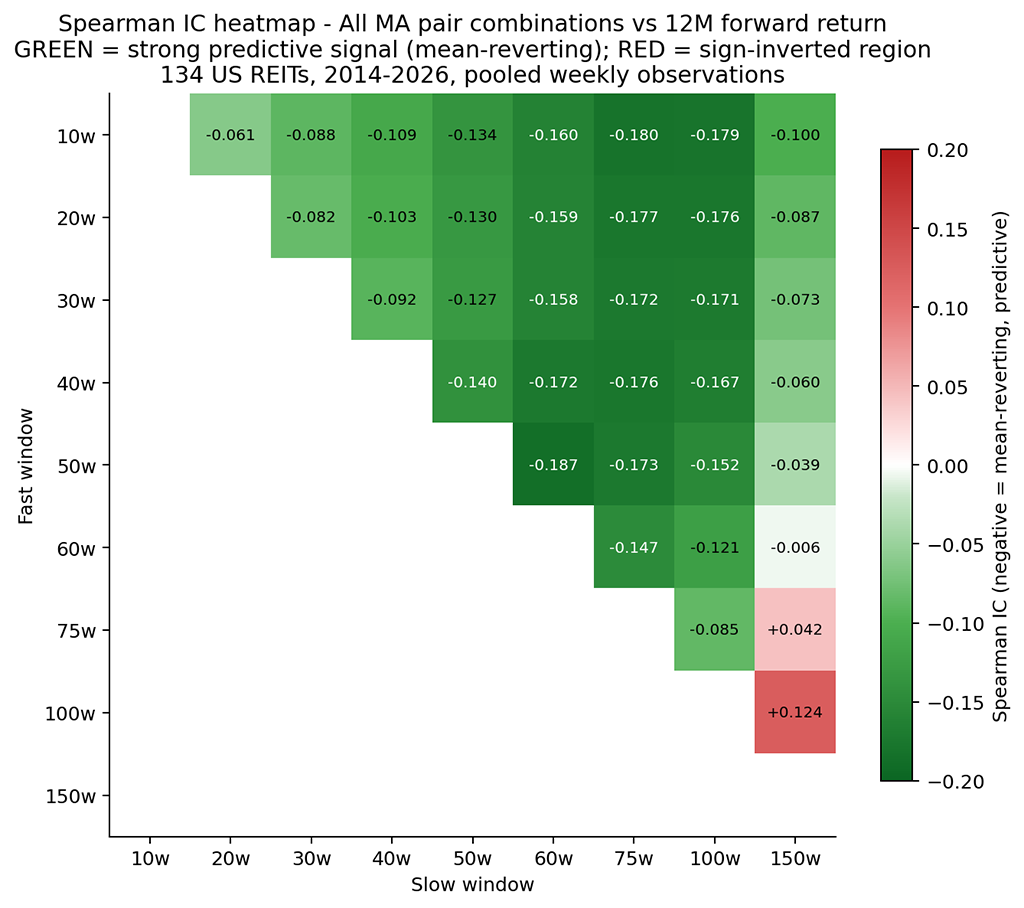
Two things jump out:
- The map is overwhelmingly green. Every fast/slow pair with a slow window of 100 weeks or less shows a negative information coefficient - mean-reversion, not trend. The sign is consistent across all 35 of these combinations.
- The signal peaks at a slow window of about 60-75 weeks. Roughly 14 to 18 months of price history appears to be an effective long-term reference for REITs in this sample. Too short and there is no anchor; too long and the reference goes stale.
The strongest pair we tested, 50 weeks against 60 weeks, produced an information coefficient of -0.187. While weekly observations overlap substantially, the relationship remains statistically meaningful after correcting for that dependence (Newey-West t-statistic of -14). The 20% of weeks where this ratio was highest delivered an average 12-month return of -7%; the 20% of weeks where it was lowest delivered +4%. A spread of roughly 12 percentage points.
Why this might happen in REITs specifically
REITs are a particular kind of equity. They are yield-sensitive, long-duration, and heavily influenced by interest-rate expectations, credit conditions, and capital flows into and out of real-asset allocations. Their underlying cash flows - rents, lease renewals, occupancy - move slowly and are anchored by physical assets with private-market NAVs that re-rate over years, not weeks. Their listed prices, by contrast, can move quickly when macro narratives shift.
That combination creates a structural gap between price and fundamental value that opens during rate-driven rallies and closes during the subsequent re-pricing. When the 50-week MA runs well above the 100-week, the stock typically appears extended relative to its longer-term trend - often because a rotation into yield, a fall in the long end of the curve, or sector enthusiasm has pulled the price ahead of the slow-moving fundamentals. The reverse happens during rate-driven drawdowns, when prices overshoot to the downside while NAVs and cash flows remain relatively stable. The pattern in the data is consistent with this kind of slow re-anchoring.
Sentiment is fast; cash flows are slow. The data shows extreme deviations between the two MAs being worked off over the following twelve months - not always cleanly or quickly, but with enough regularity to register as a strong negative correlation across 75,000 observations.
What we do with it
The 50w/100w ratio (along with two siblings, 50w/60w and 75w/100w) is one of the inputs we continue to monitor as a complementary signal in our REIT pricing work, alongside fundamental metrics like cap rate, dividend yield, and P/FFO. The information it adds is largely orthogonal to those traditional valuation measures, which is why it has a place in the toolkit rather than restating what those measures already capture.
This is a research note, not an investment recommendation. The relationship appears persistent in the historical sample, but markets evolve, REITs are sensitive to changing rate regimes, and 12 years is one full cycle. We monitor the signal in production and re-evaluate quarterly. A separate paper covers how the same finding translates - or does not translate - into a tradeable long-short strategy.