In Real Estate, the Ride Predicts the Destination
By Arialgo Research
Key takeaways
- Two investments that end at the same return can be very different investments. The path matters, and the Sharpe ratio is the standard way to capture it in a single number.
- In U.S. equity REITs over the last decade, the top-Sharpe cohort has earned a meaningful premium in forward total returns over the bottom-Sharpe cohort - a pattern that holds across multiple specifications of the underlying signal.
- Over our sample period, the conventional intuition that extreme Sharpe values mean-revert did not hold in U.S. equity REITs. Forward returns rose monotonically from the bottom-Sharpe cohort to the top.
- Quality compounds in real estate. The ride an investment has had carries information about the ride that is coming.
The question we set out to answer
Most investors evaluate a real estate security by its return. That works - until it doesn’t. Two investments can produce nearly identical total returns over a multi-year window and represent very different experiences for the people who actually held them. The dispersion is hidden in the path.
Consider the spring of 2020. Simon Property Group, one of the largest U.S. REITs at the time, fell more than 70% from its peak before recovering. American Tower, an even larger REIT in the same broad asset class, fell roughly 30% over the same window. By the end of 2021, both stocks had recovered and ended positive - SPG up about 26% on a total-return basis, AMT up about 33%. On paper, they look like comparable outcomes. To the investor who actually lived through them, they were not the same investment.
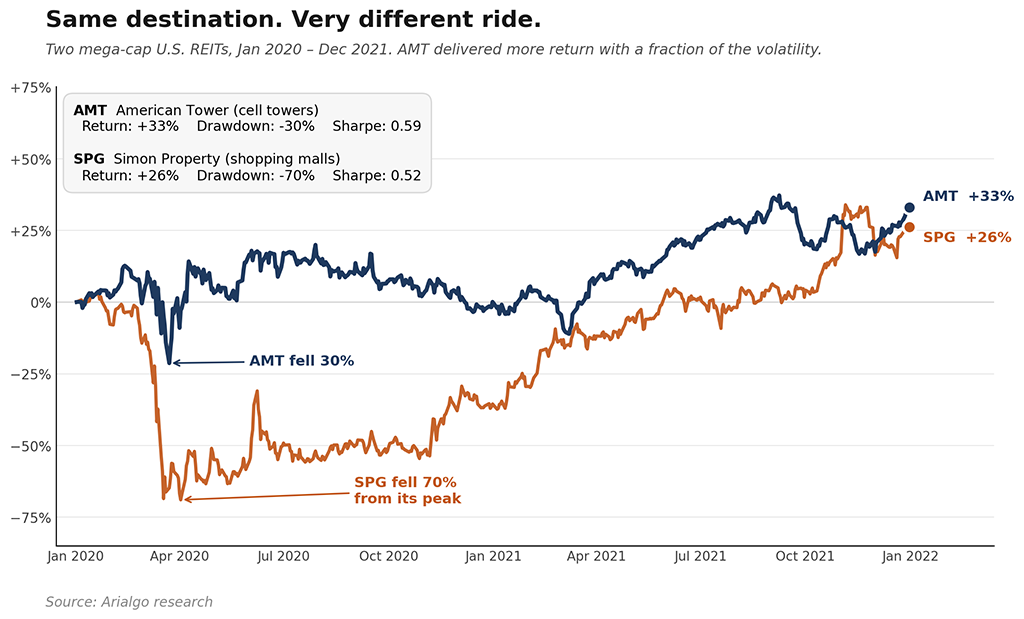
The standard measure is the Sharpe ratio - annualized excess return per unit of volatility, typically computed over a rolling window of daily total returns. Over the 24-month window above, AMT delivered a Sharpe of 0.59. SPG delivered 0.52. Close, but not the same.
For a long time, the Sharpe ratio has been understood primarily as a backward-looking quality metric: a way to describe the experience an investor had. The question we wanted to test is whether it carries forward-looking information as well.
What the data shows
We pooled every (ticker, month-end) observation across 127 U.S. equity REITs from 2015 through 2025 and ranked them cross-sectionally each month by their trailing Sharpe ratio. We then computed each observation’s forward total return, including dividends, and grouped the universe each month into three risk-adjusted performance cohorts: the bottom 30%, the middle 40%, and the top 30%.
If the conventional mean-reversion intuition were correct, we would expect to see the top cohort give back its lead going forward. Instead, the pattern is the opposite - and notably consistent.
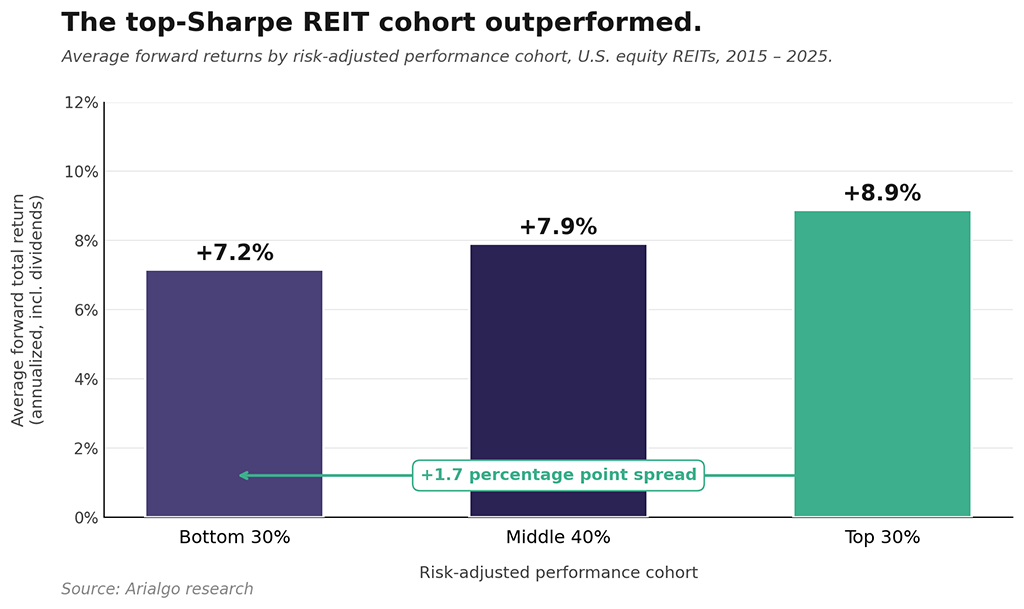
Forward returns rise across the cohorts, monotonically. The bottom-Sharpe cohort earned an average of around +7% per year on a forward total-return basis. The middle cohort earned roughly +8%. The top-Sharpe cohort earned roughly +9% - a spread of close to two percentage points per year between the top and bottom thirds of the universe.
The chart above is a composite, equal-weighted across multiple specifications of the underlying signal. Different individual specifications produce cohort spreads ranging from roughly one to three percentage points per year. The composite is intended as a single, representative summary; the body of the underlying research examines the range of specifications and their variation in detail.
The pattern is robust: across every individual specification tested, the top-Sharpe cohort outperformed the bottom-Sharpe cohort. It is not an artifact of any single year, including 2020.
Why this might be specific to real estate
A reasonable first question is whether this is simply a restatement of price momentum. It is not. A Sharpe-based ranking penalizes unstable or highly volatile advances, and therefore distinguishes between speculative rallies and persistent compounding. In our sample, many of the highest raw-return REITs do not appear in the top Sharpe cohort - their return paths were too unstable. The signal selects on the quality of the appreciation, not its magnitude.
The mean-reversion intuition has not been pulled out of thin air. In growth equities and other high-momentum asset classes, extreme positive return streaks often do mean-revert. The reason is that extreme returns in those segments are typically achieved through parabolic price moves - and parabolic moves expand the volatility in the Sharpe denominator, which keeps the very highest Sharpe values rare and often unsustainable.
Real estate behaves differently. REIT returns are anchored to property cash flows, lease economics, and slower-moving thematic tailwinds. Securities that reach the top of the Sharpe distribution in this asset class typically did so through persistent, low-volatility appreciation - the opposite of conditions that precede reversal. Put differently: in REITs, a high Sharpe usually signals smooth compounding, not a stretched rubber band.
Quality compounds. The pattern in the data is consistent with that mechanism.
What we conclude
For investors who allocate to U.S. listed real estate, the practical implication is straightforward. Risk-adjusted performance is not just a comfort metric describing past experience - at the cohort level, it has carried forward-looking information. Owning the top-Sharpe cohort has, on average, beaten owning the bottom-Sharpe cohort by a meaningful margin, with the pattern holding across multiple specifications of the signal.
Crucially, this is a cohort-level result, not a precise per-stock forecast. The actionable form is a portfolio construction principle: hold the quality cohort, avoid the bottom, accept the middle as it comes. That principle aligns with how systematic real estate strategies are actually built.
For an industry that still evaluates managers and securities primarily on total return or fundamental screens, this is worth weighing carefully. The ride an investment has had - captured in a single, simple number - tells you something about what is coming next.
Caveats and limitations
Universe. The analysis covers 127 U.S. equity REITs across 13 property sectors. Mortgage REITs and externally managed service-heavy structures are excluded. Nine tickers affected by acquisitions during the sample window are truncated at their acquisition announcement dates. The findings are specific to this universe and may not generalize to other real estate vehicles (private real estate, real estate operating companies, infrastructure beyond listed REITs) or to other asset classes.
Sector composition. Part of the observed effect may reflect persistent sector-level quality differences within REITs, including the long-term outperformance of property types with more stable cash-flow characteristics (industrial, towers, data centers, certain healthcare sub-segments) relative to those with structurally challenged demand (regional malls, traditional office). A Sharpe-based ranking will naturally over-weight the former and under-weight the latter, and a meaningful portion of the cohort spread is consistent with that effect.
Time window. The 2015 – 2025 sample includes the COVID crash of 2020, the 2022 rate shock, and the AI-driven rotation of 2023 – 2024. It does not include a full credit-crisis episode comparable to 2007 – 2009 or a prolonged stagflationary regime. Patterns observed here should not be assumed to hold identically through every future regime.
Sample size and significance. The cohort finding is computed across roughly 15,000 pooled observations, which provides ample statistical power for the overall pattern. The signal’s strength within any specific window or sub-period is more variable, and the magnitude of the effect would be expected to be lower in realized portfolio deployment than in this descriptive analysis.
Methodology summary. Sharpe ratios are computed on rolling windows of daily total returns (price appreciation plus accrued dividends), annualized in the standard way. The cohort analysis groups names cross-sectionally each month into the bottom 30%, middle 40%, and top 30% by their trailing Sharpe value; forward total returns are then averaged within each cohort and aggregated across multiple Sharpe-window lengths and forward-horizon specifications. Sharpe values are sourced from Arialgo’s production data system; the underlying calculation conventions (specific risk-free rate, dividend treatment) are documented separately and available on request. No transaction-cost or implementability adjustments are applied to the cohort analysis itself - it describes the underlying signal’s relationship to forward returns, not the realized performance of a tradable strategy.
Not a strategy. This note describes a finding about how REITs behave, not a deployable investment strategy. Implementing a strategy based on this signal would introduce considerations - portfolio construction, sector concentration, drawdown management, transaction costs, capacity - that are not addressed here.
Disclaimers
This research note is provided for informational and educational purposes only. It does not constitute investment advice, a recommendation to buy or sell any security, or an offer to provide investment advisory services. Nothing in this note should be construed as a forecast or guarantee of future investment performance.
Specific securities named in this note (including Simon Property Group and American Tower) are referenced solely as historical illustrations for analytical purposes. References to specific securities should not be interpreted as a recommendation to buy, hold, or sell those securities or as an indication of Arialgo’s current or future portfolio positioning.
Past performance is not indicative of future results. Investing in real estate securities involves risk, including the possible loss of principal. Investors should consider their own financial situation and consult with appropriate professional advisors before making any investment decision.
The analysis presented relies on historical price data and proprietary calculations. While Arialgo believes the data sources are reliable, no representation is made as to the accuracy or completeness of any third-party data referenced.
© 2026 Arialgo Ltd. All rights reserved.