When Equilibrium Becomes the Risk
Why both tails of the ARI distribution outperform - and why the middle of the REIT universe is where forward returns go to die.
Most factor signals tell a simple, ordered story: high beats low, or low beats high. Buy the cheap names; avoid the expensive ones. Or the reverse. The ranking is monotonic.
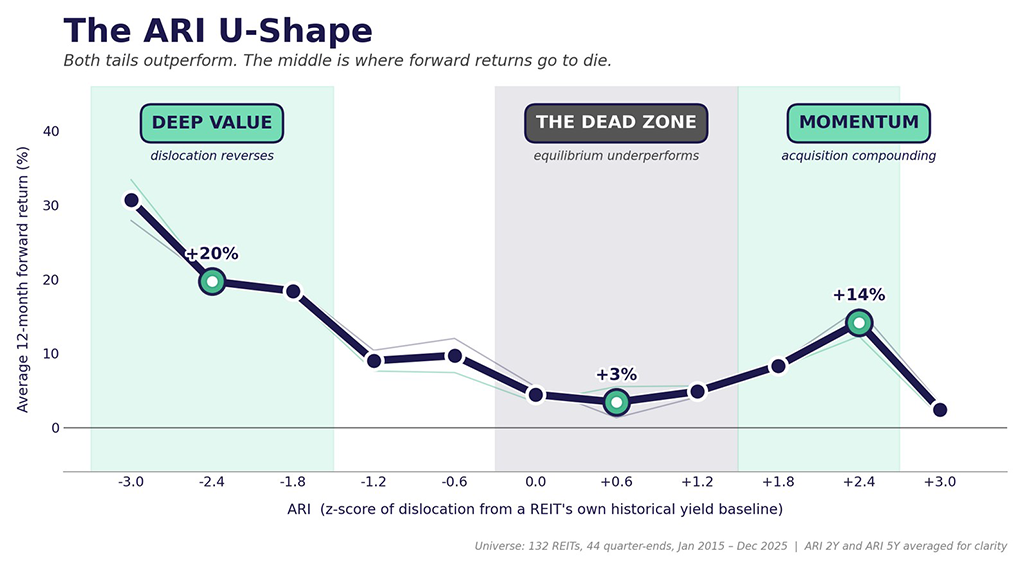
The Arialgo Relative Indicator (ARI) tells a different story. ARI measures how unusually wide or narrow a REIT's current excess yield is relative to that company's own historical baseline - a per-company z-score of dislocation from its own equilibrium spread to Treasuries. We computed it on a universe of 132 REITs over January 2015 through December 2025. The forward-return relationship is U-shaped: both extremes outperform, and the middle of the distribution - where most names sit most of the time - is where forward returns are weakest.
Reading the signal. Because REIT dividends are sticky, ARI moves almost entirely with price. A falling price widens the spread above the REIT's own history and pushes ARI deeply negative - the deep-value tail. A rising price compresses the spread below history and pushes ARI deeply positive - the momentum tail. Each tail outperforms the middle, but for entirely different economic reasons.
That last point is the conceptually unusual one. Equilibrium is the risk. Alpha lives in dislocation and in structural compounding; it does not live where the bulk of the universe trades day-to-day.
What the U-shape actually says
At the deep-negative tail - ARI roughly ≤ -2 - average 12-month forward returns range from +20% to +33%, depending on the signal tenor.
At the deep-positive tail - ARI roughly ≥ +2 - the 12-month forward return in the momentum-peak bucket averages +12% to +16%. Smaller in magnitude than the value tail, but still meaningfully above the trough.
The trough sits at ARI ≈ +0.3 to +1.5 - names trading at or just above their own historical equilibrium spread. Forward 12-month returns there fall to +1% to +6%. Many conventional yield-ranking approaches naturally concentrate near this zone.
Two tails, two different mechanisms
The two tails outperform for economically distinct reasons. They are not mirror images of each other.
The deep-value tail: dislocation and overshoot
When ARI goes deeply negative, four interpretations are possible: a correctly priced impending dividend cut, market dislocation, sentiment overhang, or downside momentum overshoot. ARI alone cannot tell you which applies in any individual case. But on average, across the universe and across time, the dislocation and overshoot interpretations dominate the correct-call interpretation by enough margin that deeply-deviated portfolios outperform.
A subset of deep-value names do experience genuine dividend cuts. The positive average is driven by the dominance of recovering names - not uniform recovery. This is why ARI is one signal in a layered scoring system: company-health indicators (payout ratio, debt coverage, FFO growth) do the work of separating mispriced distress from genuine impairment.
Alpha lives in dislocation and in structural compounding - not where the bulk of the universe trades day-to-day.
The momentum tail: acquisition-driven compounding
The right tail outperforms through a mechanism specific to REITs. A high ARI means the REIT's price has rallied enough to compress its dividend yield well below its own historical baseline - and a compressed yield is itself a low cost of capital. The REIT can issue equity at a high P/AFFO multiple and deploy the proceeds into real estate acquisitions at prevailing market cap rates. Capital raised at a 4% AFFO yield deployed into properties yielding 6% cap rates produces immediate per-share AFFO accretion. The REIT compounds AFFO faster than peers through accretive external growth, which justifies continued multiple expansion and sustains the cycle.
This is not the equity-factor sense of "momentum." It is an operationally-grounded compounding mechanism rooted in how REITs aggregate capital and deploy it. The compressed yield is the enabler of value-creating activity, not a sentiment artifact.
The mechanism weakens at the most extreme right tail. When the cost of capital compresses below market cap rates, accretive acquisitions become impossible and the compounding cycle stalls. Empirically, the right tail strengthens up to roughly ARI = +2.7 and then deteriorates - consistent with the mechanism running out of fuel.
Three cases from the data
Three real examples illustrate how the signal flags dislocation in advance - and the variability of when the recovery shows up.
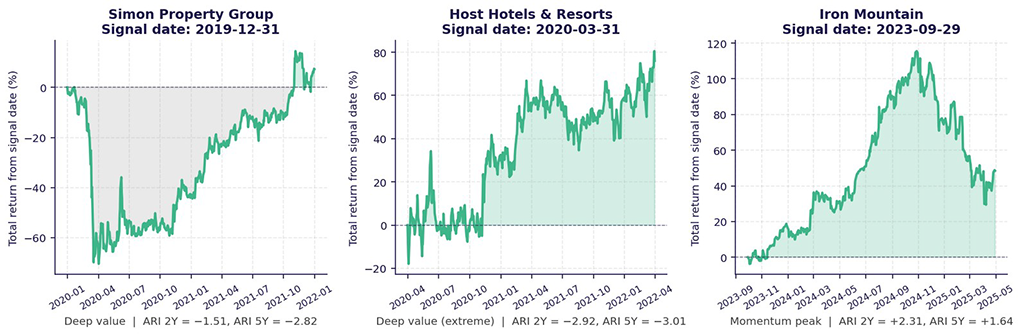
Simon Property Group, December 31, 2019 - ARI 2Y = -1.51, ARI 5Y = -2.82
At end-2019, Simon's spread to Treasuries had widened materially against its own history. ARI 5Y flagged it as a near-deep-value name. What happened next is instructive: the price continued to deteriorate through Q1 2020, bottoming at -63% by March 31, 2020 as COVID introduced an exogenous shock to mall traffic. At 12 months the position was still down 43%; flat by 18 months; +7% by 24 months. The spread dislocation identified at end-2019 deepened further before mean reversion began.
The point: ARI is a dislocation indicator, not a timing call. A correct flag and a delayed recovery are the same observation viewed from different time horizons.
Host Hotels & Resorts, March 31, 2020 - ARI 2Y = -2.92, ARI 5Y = -3.01
Three months later, the lodging sector was at the heart of the COVID drawdown and Host sat in the extreme deep-value bucket - ARI 2Y of -2.92, deeper than Simon's end-2019 reading. The first six months were essentially flat (-2%), then the recovery took hold: +53% at 12 months, +76% at 24 months. The signal flagged a dislocated company; the recovery propagated through the sector as macro stress eased.
The point: when the dislocation is real and the sector is positioned to recover, the value-tail mechanism delivers cleanly. The 0.66 within-sector forward-return correlation we measure across the universe is why - the company is the trigger, the sector is the delivery vehicle.
Iron Mountain, September 29, 2023 - ARI 2Y = +2.31, ARI 5Y = +1.64
Iron Mountain is a different kind of case. By Q3 2023 the name was trading at a yield deeply compressed against its own history - ARI 2Y squarely in the momentum-peak bucket. The compression reflected the data-center growth thesis: a REIT funding an aggressive acquisition pipeline from a low cost of capital, deploying into accretive real-asset cap rates. Twelve months later the position was up +100%.
The point: the momentum tail is real and economically distinct from the value tail. Same framework, different mechanism - a deployment that ranks ARI as a single ordered factor cannot see both at once.
What this means for portfolio construction
The conventional "high-versus-low" framing does not capture the predictive content of ARI. A naive barbell that holds both tails against the middle largely fails: at typical portfolio sizes the tails span moderate buckets that earn near-middle returns. The U-shape lives in the extreme bins.
Effective deployment requires explicit non-monotonic treatment plus sector aggregation. The within-sector forward-return correlation of 0.66 (versus 0.43 cross-sector) tells us the most natural aggregator is the sector
- ARI flags companies, the sector delivers the mean reversion. That deployment work is the subject of the strategy paper that follows.
Once forward returns become U-shaped rather than monotonic, traditional ranking frameworks stop being sufficient. In REITs, the center of equilibrium is where the informational edge disappears.